 ar
ar bg
bg hr
hr cs
cs da
da nl
nl fi
fi fr
fr de
de el
el hi
hi it
it ko
ko no
no pl
pl pt
pt ro
ro ru
ru es
es sv
sv tl
tl iw
iw id
id lv
lv lt
lt sr
sr sk
sk sl
sl uk
uk vi
vi et
et hu
hu th
th tr
tr fa
fa ms
ms hy
hy ka
ka ur
ur bn
bn mn
mn ta
ta kk
kk uz
uz ku
ku
Visualization Software
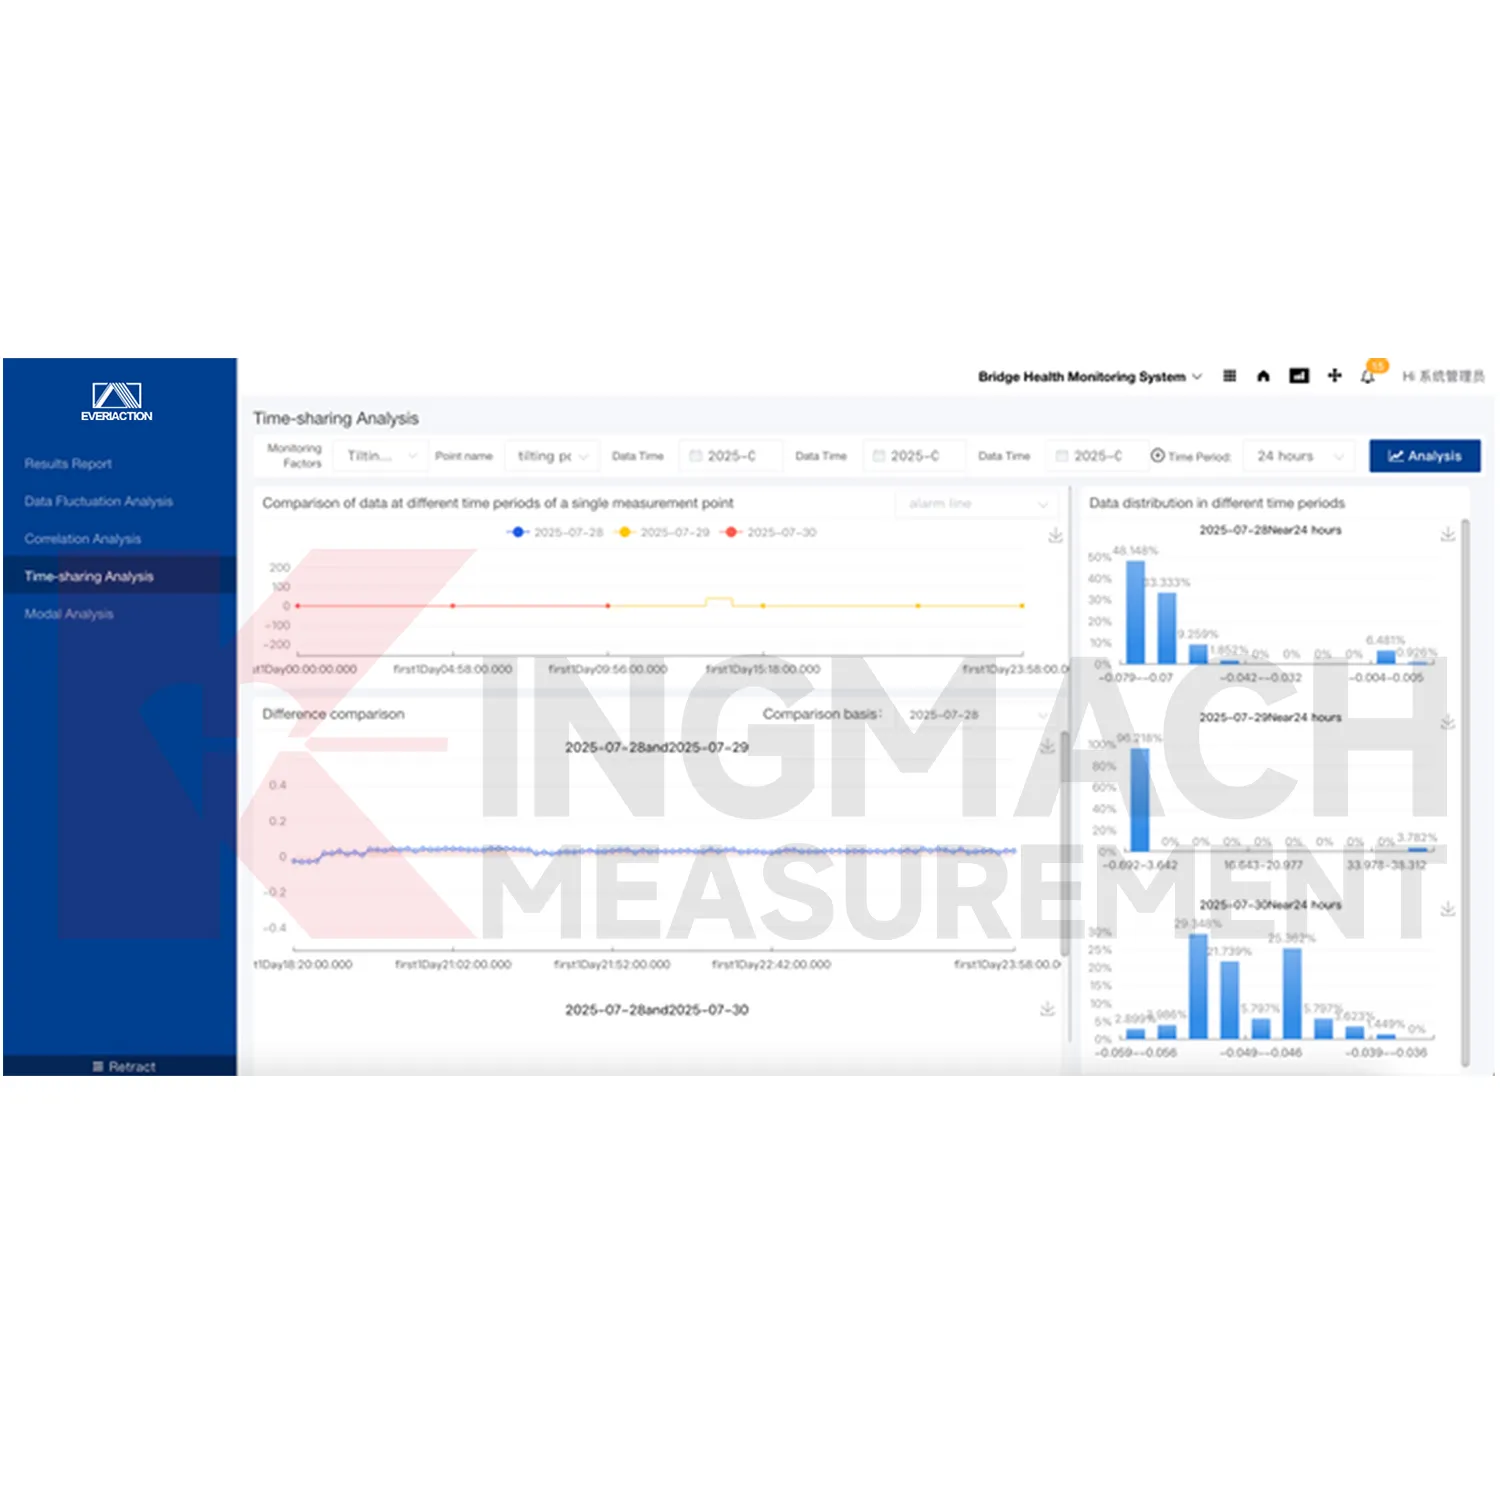
Kingmach Visualization Software refers to the Monitoring system software platform, also described in the local files as the Cloud Platform. It is based on Internet of Things, big data, and cloud computing technologies for all-round monitoring of civil engineering structure safety. The platform receives data from monitoring devices, stores it, filters it, analyzes it, displays it, and supports project management. It is intended for infrastructure and engineering assets where multi-source readings need to be reviewed together instead of scattered across separate devices or spreadsheets.
Application of Visualization Software
Multi-site asset management uses Kingmach Visualization Software when an owner needs consistent monitoring records across several projects. Each project can keep its own basic information, dynamic information, alarm levels, documents, and maintenance records while still following a common digital workflow. This is useful for infrastructure owners, engineering firms, and maintenance teams that manage bridges, tunnels, slopes, buildings, and hydraulic structures at the same time. Standardized visualization and reporting make cross-project review more efficient.
The future of Visualization Software
Cloud computing will support wider remote use of Kingmach Visualization Software. Owners and engineering teams may need to review assets from offices, field sites, control centers, or mobile workstations. Cloud-based access helps keep monitoring visible even when the structure is difficult to reach. Remote review will not replace field verification, but it can improve timing. Teams can identify which area needs inspection, what related data should be checked, and which documents should be prepared before arriving on site.
Care & Maintenance of Visualization Software
User roles and access control are part of maintaining Kingmach Visualization Software. Owners, engineers, inspectors, operators, and report reviewers may need different permissions. Limit configuration changes to trained users and keep a record of edits to alarm rules, project information, device settings, and report layouts. This protects data integrity and makes it easier to explain later why a trend, alarm, or report changed. Good access discipline is especially important for cloud-based monitoring records.
Kingmach Visualization Software
The core value of Kingmach Visualization Software is not only display. It supports fast storage, real-time filtering, efficient analysis, complex statistics, user-friendly display, and personalized customization of collected data. These functions help convert raw sensor streams into information that can be reviewed by engineers and maintenance teams. A single abnormal point may need trend comparison, related channel review, inspection notes, and alarm history before action is taken. The platform gives those elements a common place, reducing the risk that important context is lost across separate files or devices.
FAQ
Q: How should a project be prepared?
A: Define asset folders, monitoring zones, measuring points, units, alert grades, and report needs before launch.
Q: What should be tested at go-live?
A: Test incoming values, time order, engineering units, graph refresh, alarm trigger, and export output.
Q: Why does alarm logic need review?
A: Different sensor categories and risk levels may need different limits, rates, and escalation steps.
Q: How should files stay current?
A: Update drawings, point lists, photos, inspection notes, maintenance logs, and reports when the site changes.
Q: What should follow a platform update?
A: Run a short acceptance check on live values, graph pages, alerts, exports, accounts, and stored files.
Reviews
Michael Anderson
The strain gauges and load cells are extremely accurate and stable. They performed very well in our bridge monitoring project. Highly recommended!
Matthew Garcia
Instrumentation cables are durable and perform well even in harsh environments. Will definitely order again.
Latest Inquiries
To protect the privacy of our buyers, only public service email domains like Gmail, Yahoo, and MSN will be displayed. Additionally, only a limited portion of the inquiry content will be shown.
Charlotte***@gmail.comUnited Arab Emirates
Hi, we require instrumentation cables suitable for harsh environments. Could you advise on specifica...
Mia***@gmail.comNetherlands
Dear team, we are interested in your readouts & data loggers compatible with multiple sensors. Do yo...
Related product categories
- Monitoring Software Suite
- Monitoring system software platform
- Environmental Monitoring
- Visualization Software
- GPS Displacement Monitoring System
- Integrated Monitoring Station
- Settlement Monitoring Rod
- Structural Health Monitoring (SHM) System
- Structural Monitoring Cloud Platform
- IoT Online Monitoring System
- Monitoring System Platform & Services
- Engineering Pulse Intelligent Monitoring Cloud Platform