 ar
ar bg
bg hr
hr cs
cs da
da nl
nl fi
fi fr
fr de
de el
el hi
hi it
it ko
ko no
no pl
pl pt
pt ro
ro ru
ru es
es sv
sv tl
tl iw
iw id
id lv
lv lt
lt sr
sr sk
sk sl
sl uk
uk vi
vi et
et hu
hu th
th tr
tr fa
fa ms
ms hy
hy ka
ka ur
ur bn
bn mn
mn ta
ta kk
kk uz
uz ku
ku
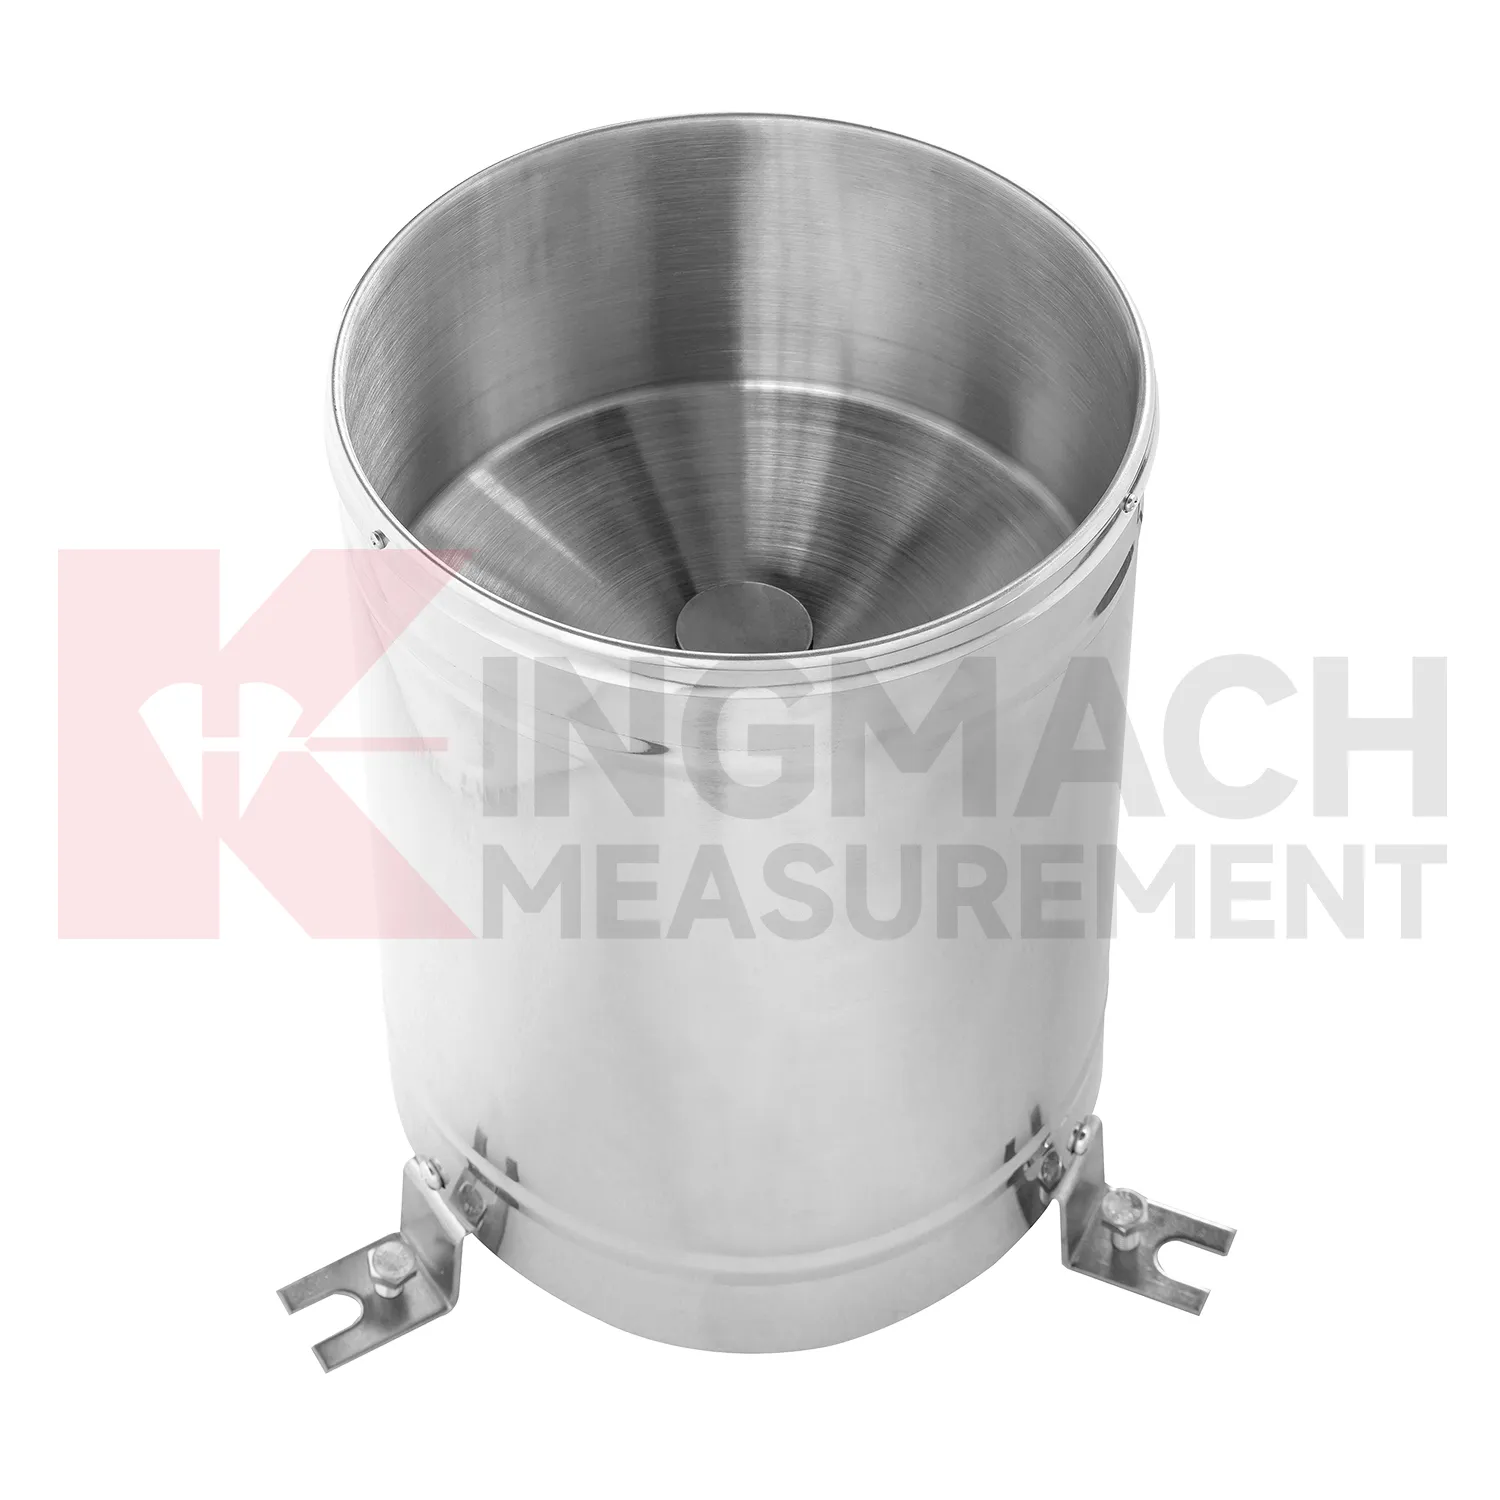
moisture sensor for soil
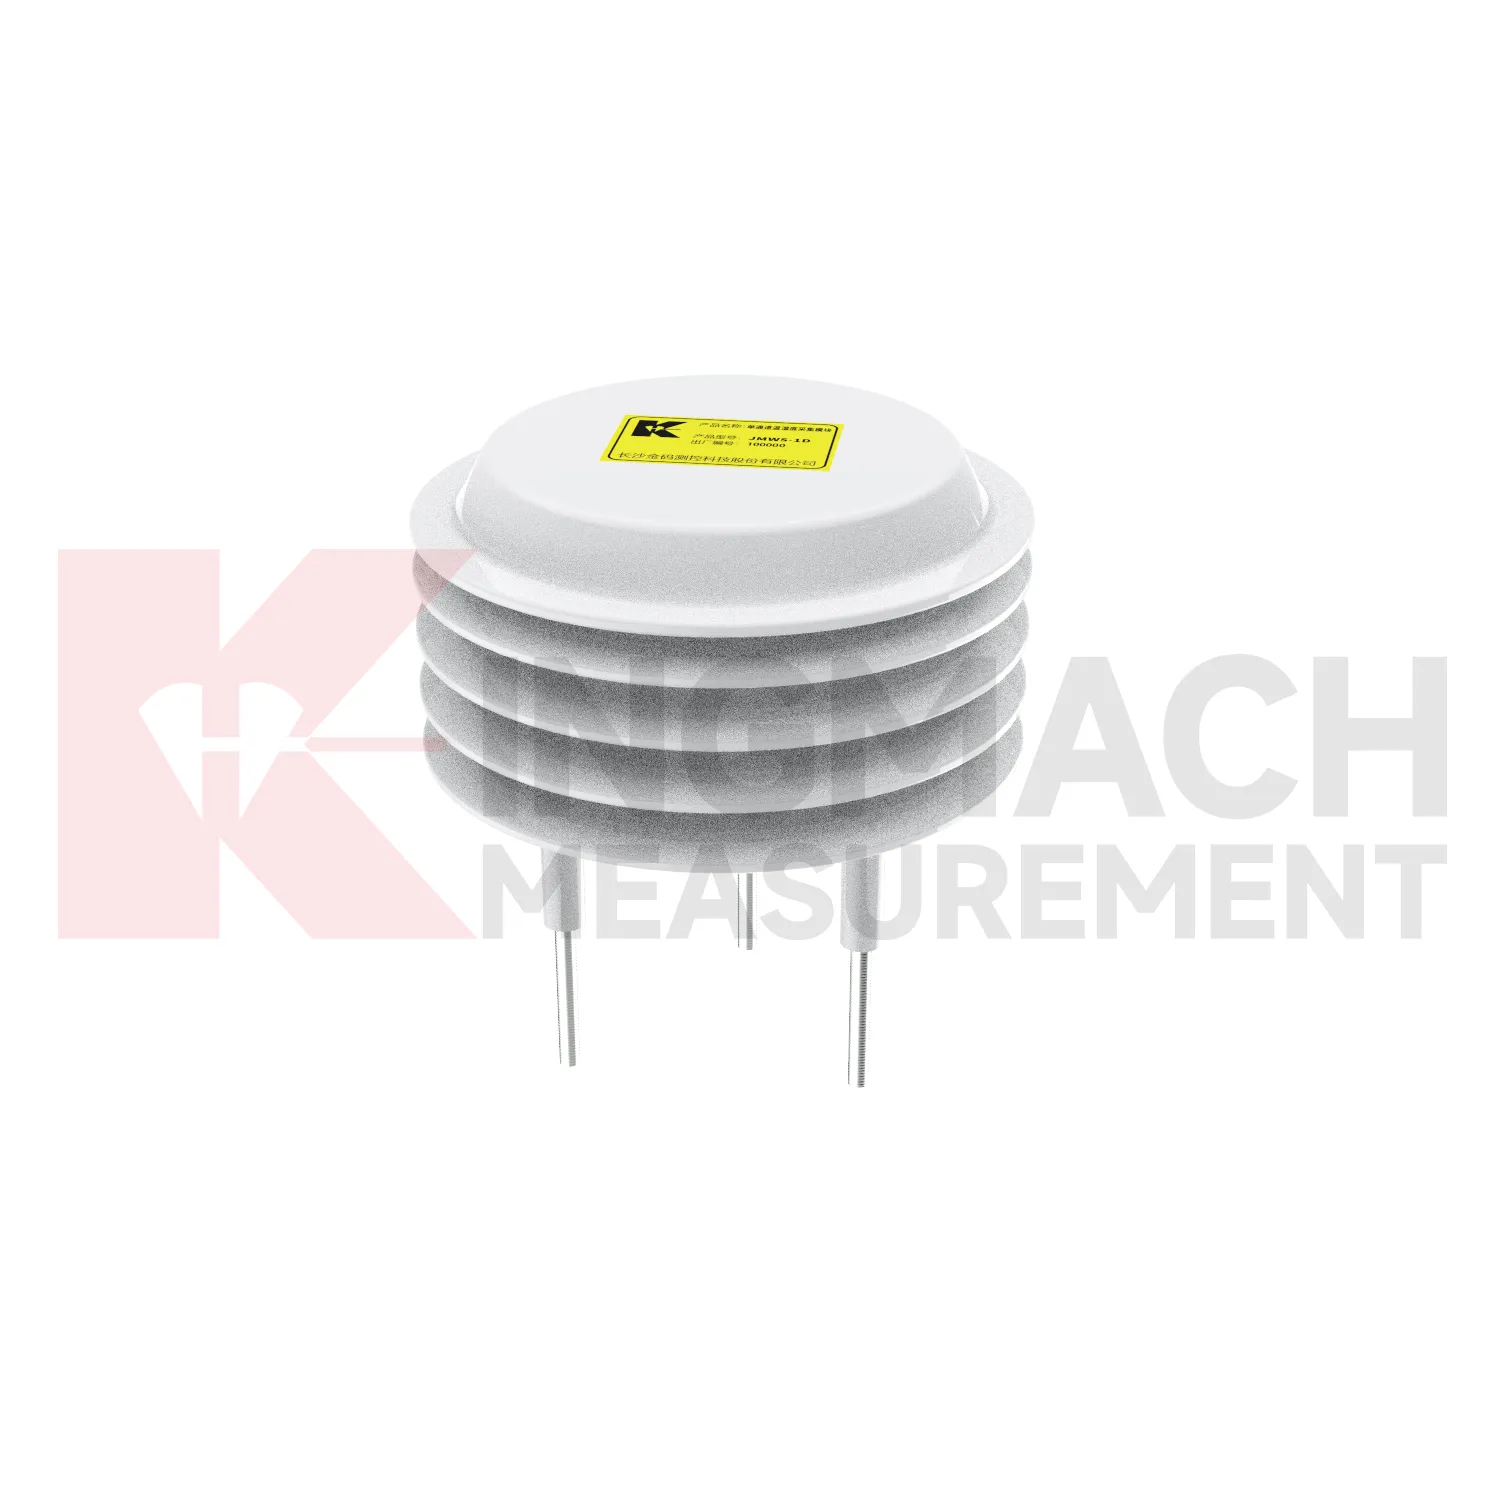
Kingmach moisture sensor for soil covers the site-condition layer of structural and geotechnical monitoring. It records the environmental forces and operating conditions that often explain why a structural sensor changes. Rainfall can precede slope movement or seepage; soil wetness can show whether water has reached a sensitive layer; temperature can affect strain, expansion, and sensor behavior; humidity can reveal cabinet and tunnel risks; wind can explain vibration, pressure, and access constraints. A useful description of this category should therefore start with the monitoring problem. The equipment is not installed to fill a dashboard with weather values. It is installed so engineers can compare conditions with settlement, displacement, tilt, load, vibration, strain, inspection notes, and maintenance actions. When these records share time stamps and point names, the owner can see both the trigger and the response. That makes abnormal-event review faster and helps long-term reports distinguish seasonal patterns from real deterioration.
If the reading seems unusual, the team should check the physical condition of the station before drawing conclusions about the asset. Blockage, poor exposure, loose wiring, water entry, and changed surroundings can all create misleading patterns.
A practical report links the condition value with time, place, and action. It should help a reviewer decide whether to keep observing, inspect the field point, compare nearby instruments, or record the event as normal site behavior.
Application of moisture sensor for soil
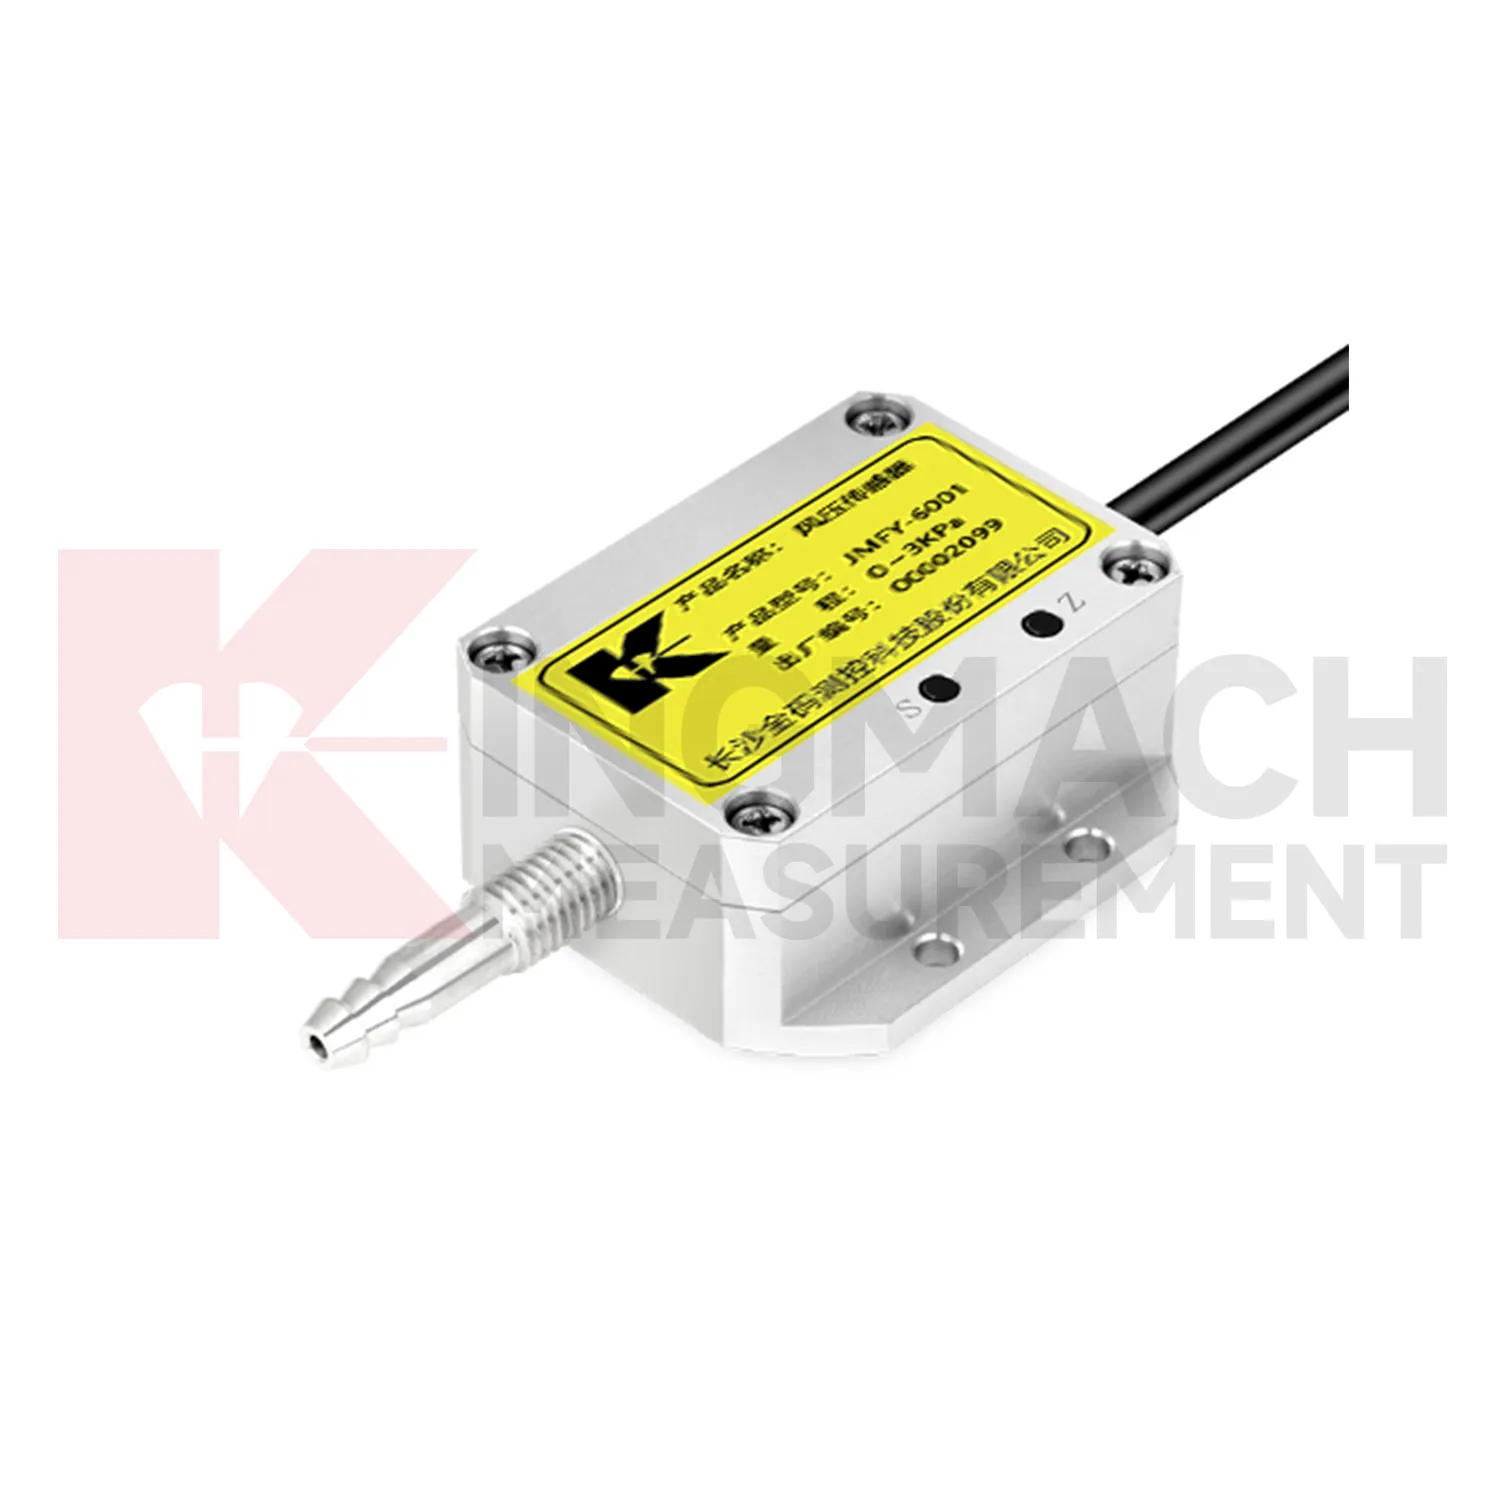
Integrated monitoring platforms use Kingmach moisture sensor for soil as the condition layer beside structural instruments. A platform should not display environmental values as decoration. Each channel should support a review path: rainfall for slope and seepage behavior, wind for bridge and tower response, temperature for strain and expansion, humidity for cabinet reliability, pressure for airflow or wind load, and soil wetness for ground movement. Setup should define units, time alignment, alarm review, linked structural channels, and maintenance responsibilities. During an abnormal event, the reviewer should be able to compare the condition change with structural response without opening separate files. That is how environmental data becomes useful in daily operation, emergency review, and long-term asset management.
Platform design should group channels by risk rather than by instrument type. A bridge wind group, slope rainfall group, tunnel humidity group, or dam seepage group is easier for field staff to understand than a long list of unrelated values. This grouping also helps alarm review because the relevant condition and response appear together.
Permission and reporting workflows matter too. Designers may need detailed curves, maintenance staff may need station status, and owners may need a plain event summary. A well-organized platform lets each user see the environmental context needed for their decision.
The future of moisture sensor for soil
The future of Kingmach moisture sensor for soil will focus on linking environmental triggers directly to structural behavior. Owners do not only need to know that rain fell, wind rose, or humidity changed. They need to know whether those conditions explain movement, strain, vibration, seepage, or equipment faults. Future monitoring reports should place condition curves and structural curves on the same timeline with inspection notes. That will make it easier to distinguish weather-driven behavior from progressive deterioration. The practical improvement is not more scattered data; it is clearer relationships. When environmental records are connected to the assets they affect, engineers can review alarms faster and plan field checks with better evidence.
This direction will also change how warning levels are written. A slope warning may depend on rainfall history and wetting trend, while a bridge warning may depend on wind period and structural response. Future systems should allow these links to be visible instead of forcing every channel into one isolated threshold.
For owners, the benefit is a shorter path from alarm to action. A reviewer can see the condition that changed, the asset that reacted, the inspection that followed, and whether the response returned to normal. That is more useful than separate charts that require manual reconstruction.
Care & Maintenance of moisture sensor for soil
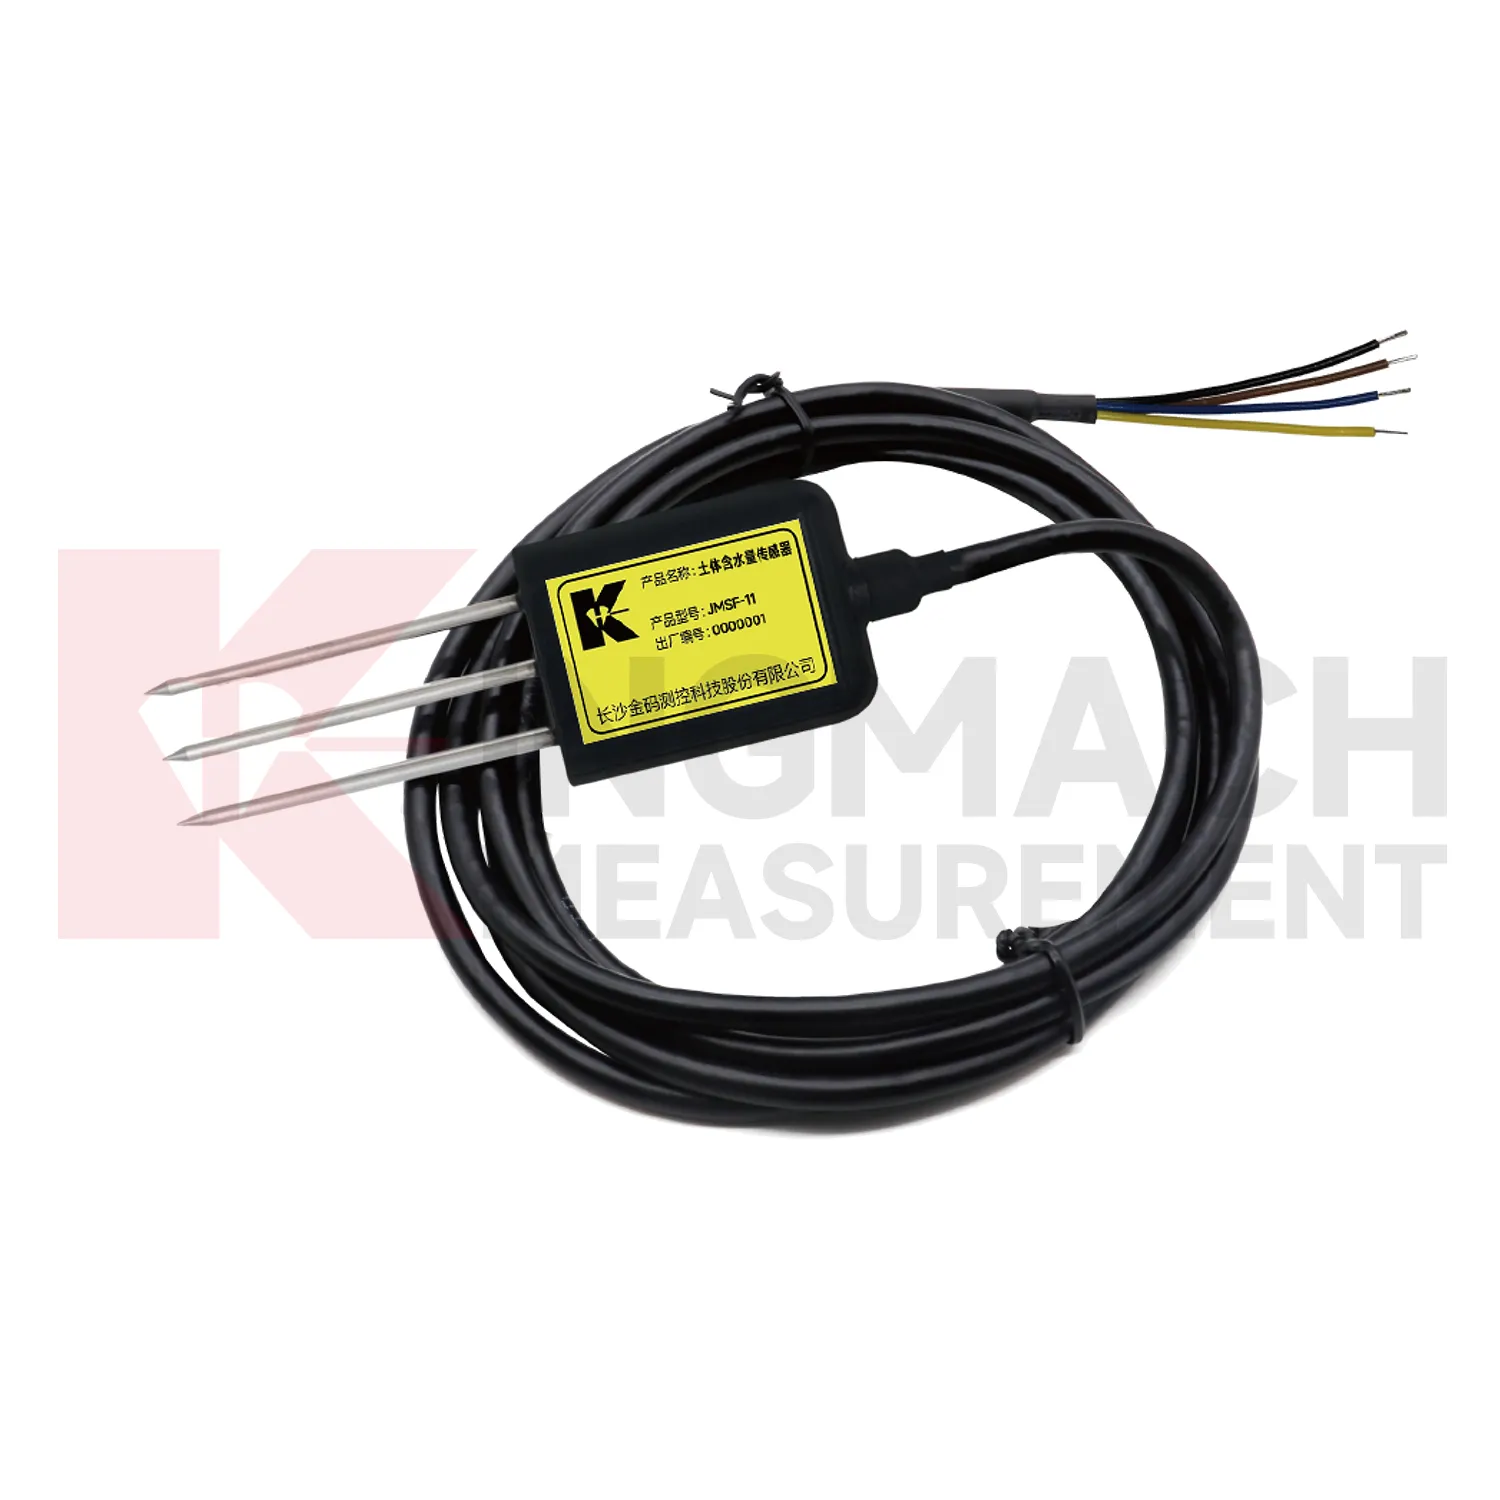
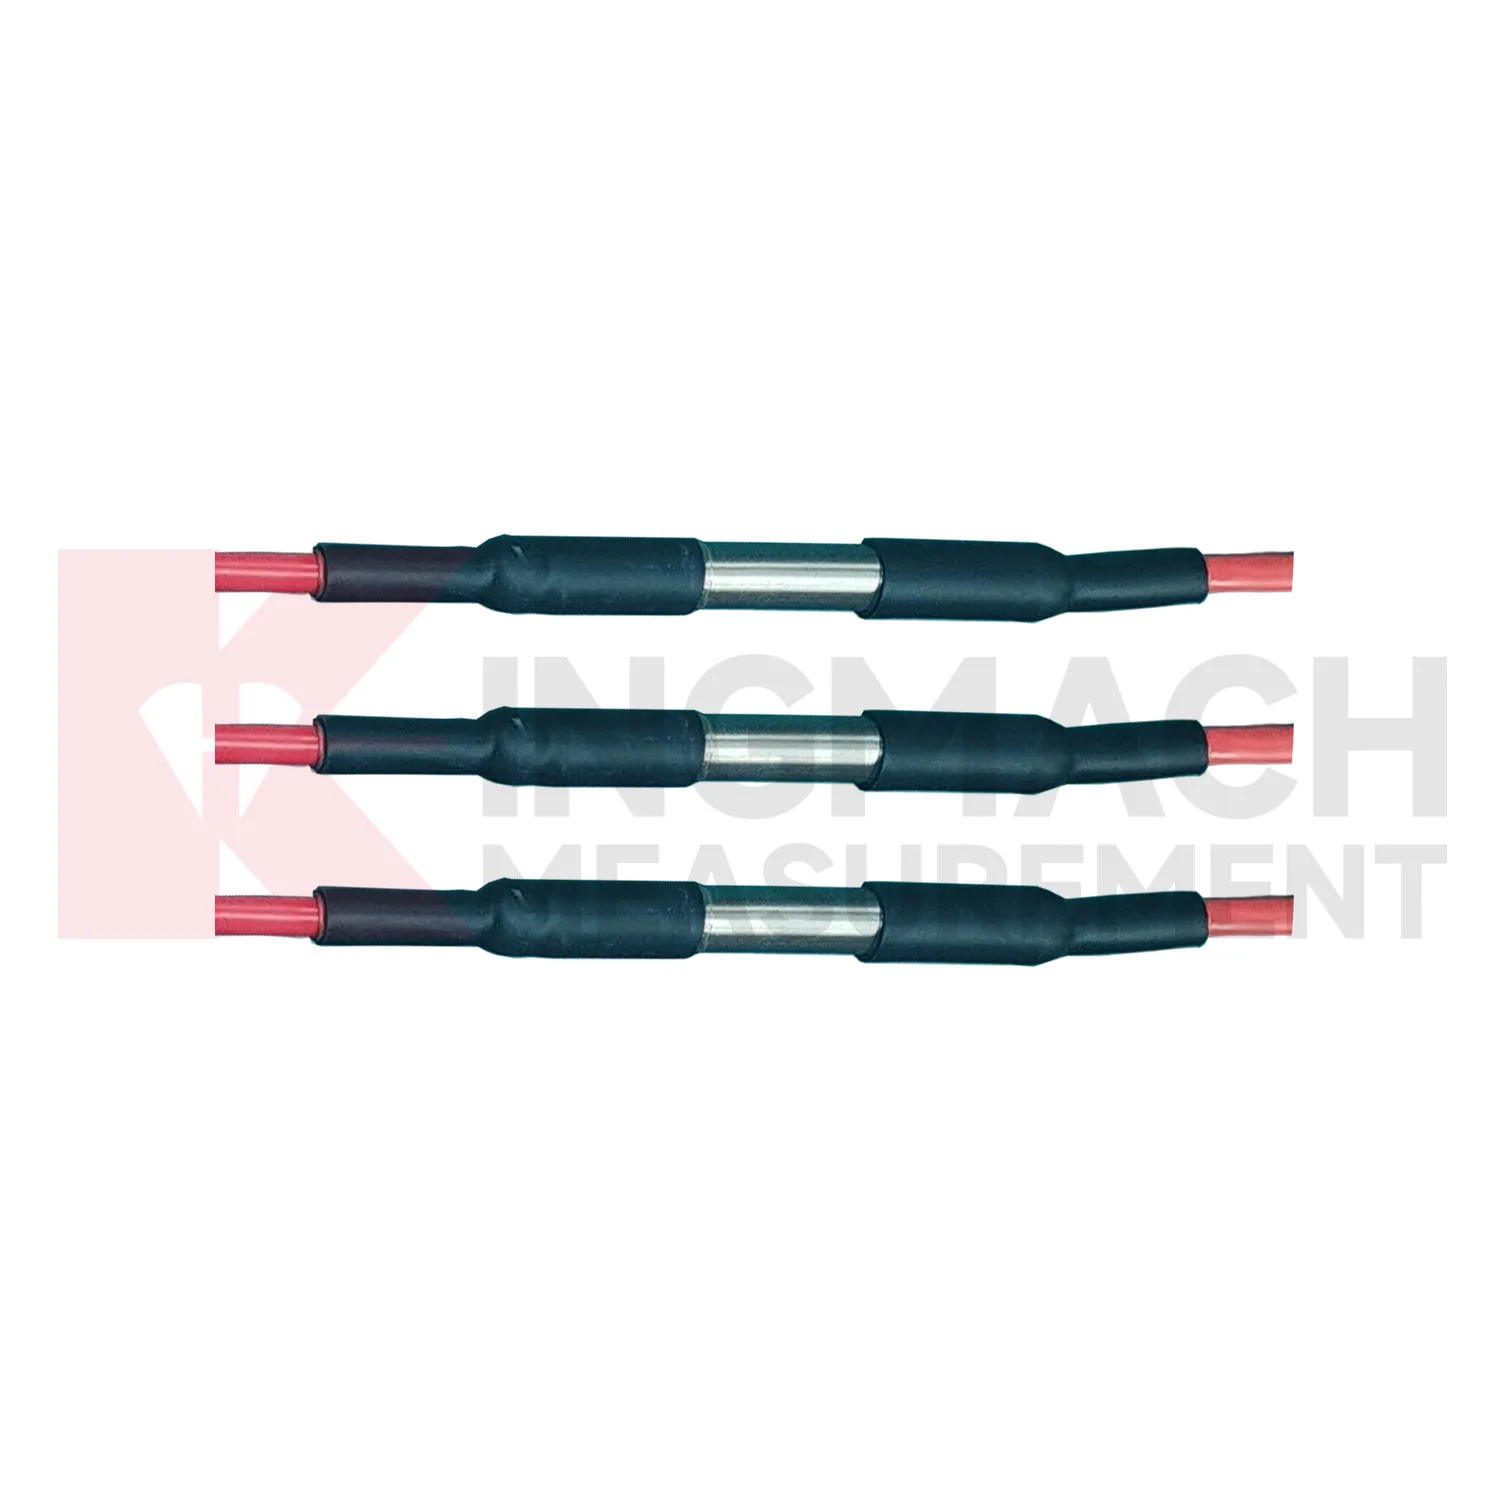
Soil-condition maintenance for Kingmach moisture sensor for soil should protect the contact between the buried point and the surrounding material. Air gaps, disturbed soil, cable damage, excavation, animal activity, or water paths along the cable can all affect readings. Installation records should include depth, soil type, location photo, cable route, and first stable value. During review, compare soil wetness with rainfall, irrigation, groundwater, and nearby deformation. If a buried channel becomes flat or jumps suddenly, inspect cable continuity and recent site work before treating it as a real soil change. Buried points are easy to forget, so their maintenance history must be visible in the project file.
If the reading seems unusual, the team should check the physical condition of the station before drawing conclusions about the asset. Blockage, poor exposure, loose wiring, water entry, and changed surroundings can all create misleading patterns.
A practical report links the condition value with time, place, and action. It should help a reviewer decide whether to keep observing, inspect the field point, compare nearby instruments, or record the event as normal site behavior.
Kingmach moisture sensor for soil
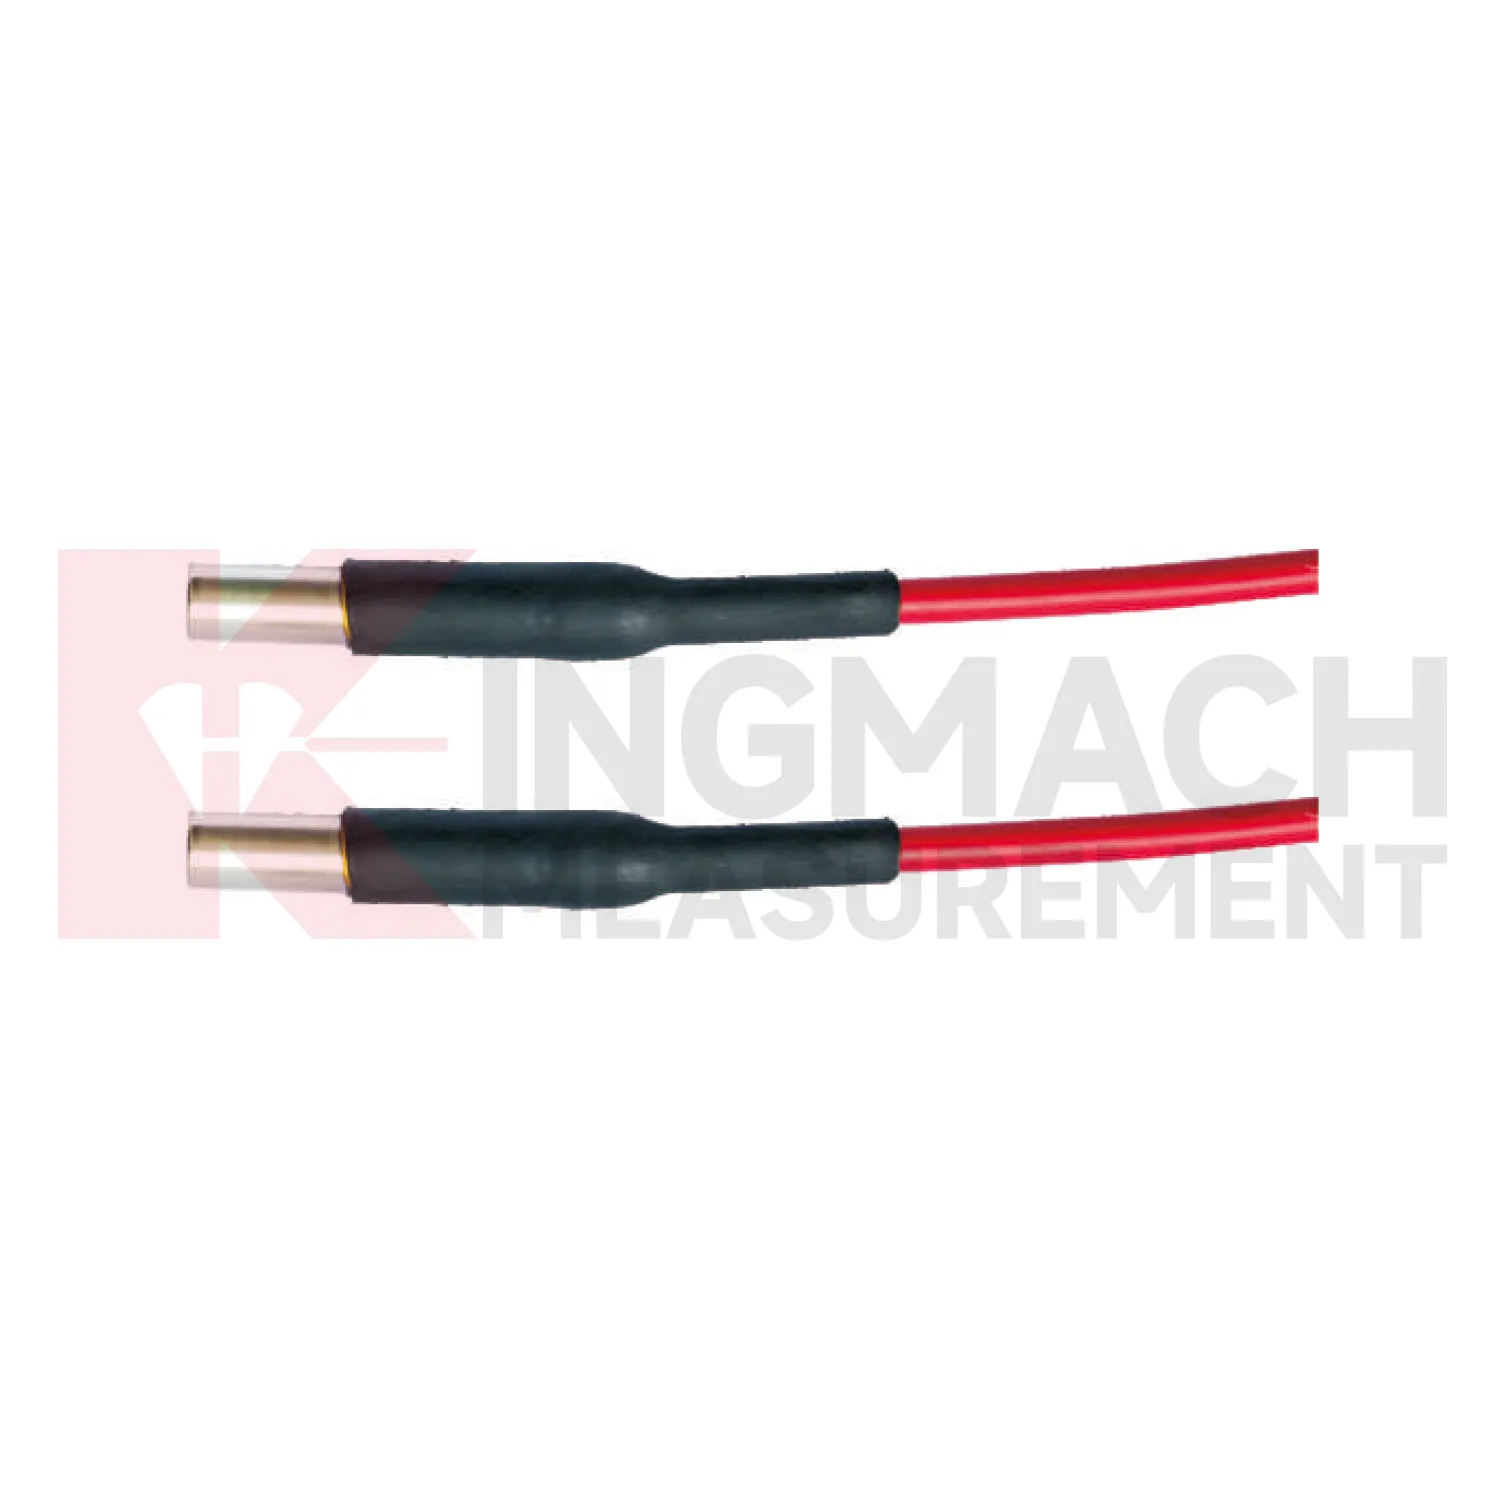
Soil wetness gives Kingmach moisture sensor for soil a direct link between weather and ground behavior. Surface rainfall alone does not show whether water reached the depth where deformation is occurring. Buried moisture readings help engineers see wetting, drying, irrigation effect, drainage performance, and seasonal change inside the soil body. This is important for slopes, embankments, greenhouses, agricultural projects, hydraulic works, and reclamation areas. A soil record should be tied to depth, soil type, cable route, and nearby deformation points. When wetness rises before displacement accelerates, the relation deserves attention. When soil dries while movement remains active, another cause may be involved. The value is in comparing conditions, not in displaying an isolated moisture number.
A practical report links the condition value with time, place, and action. It should help a reviewer decide whether to keep observing, inspect the field point, compare nearby instruments, or record the event as normal site behavior.
For owners, the strongest record is the one that remains understandable after staff changes. Clear units, plain point names, installation photos, maintenance notes, and linked structural channels make the data usable beyond the original project team.
FAQ
Q: How does rainfall data support slope review?
A: Rainfall gives the timing and intensity background for movement, seepage, wetting, and field inspections after storms.
Q: Why measure soil wetness as well as rainfall?
A: Rainfall stays at the surface record, while buried wetness shows whether water reached the soil depth that may influence movement.
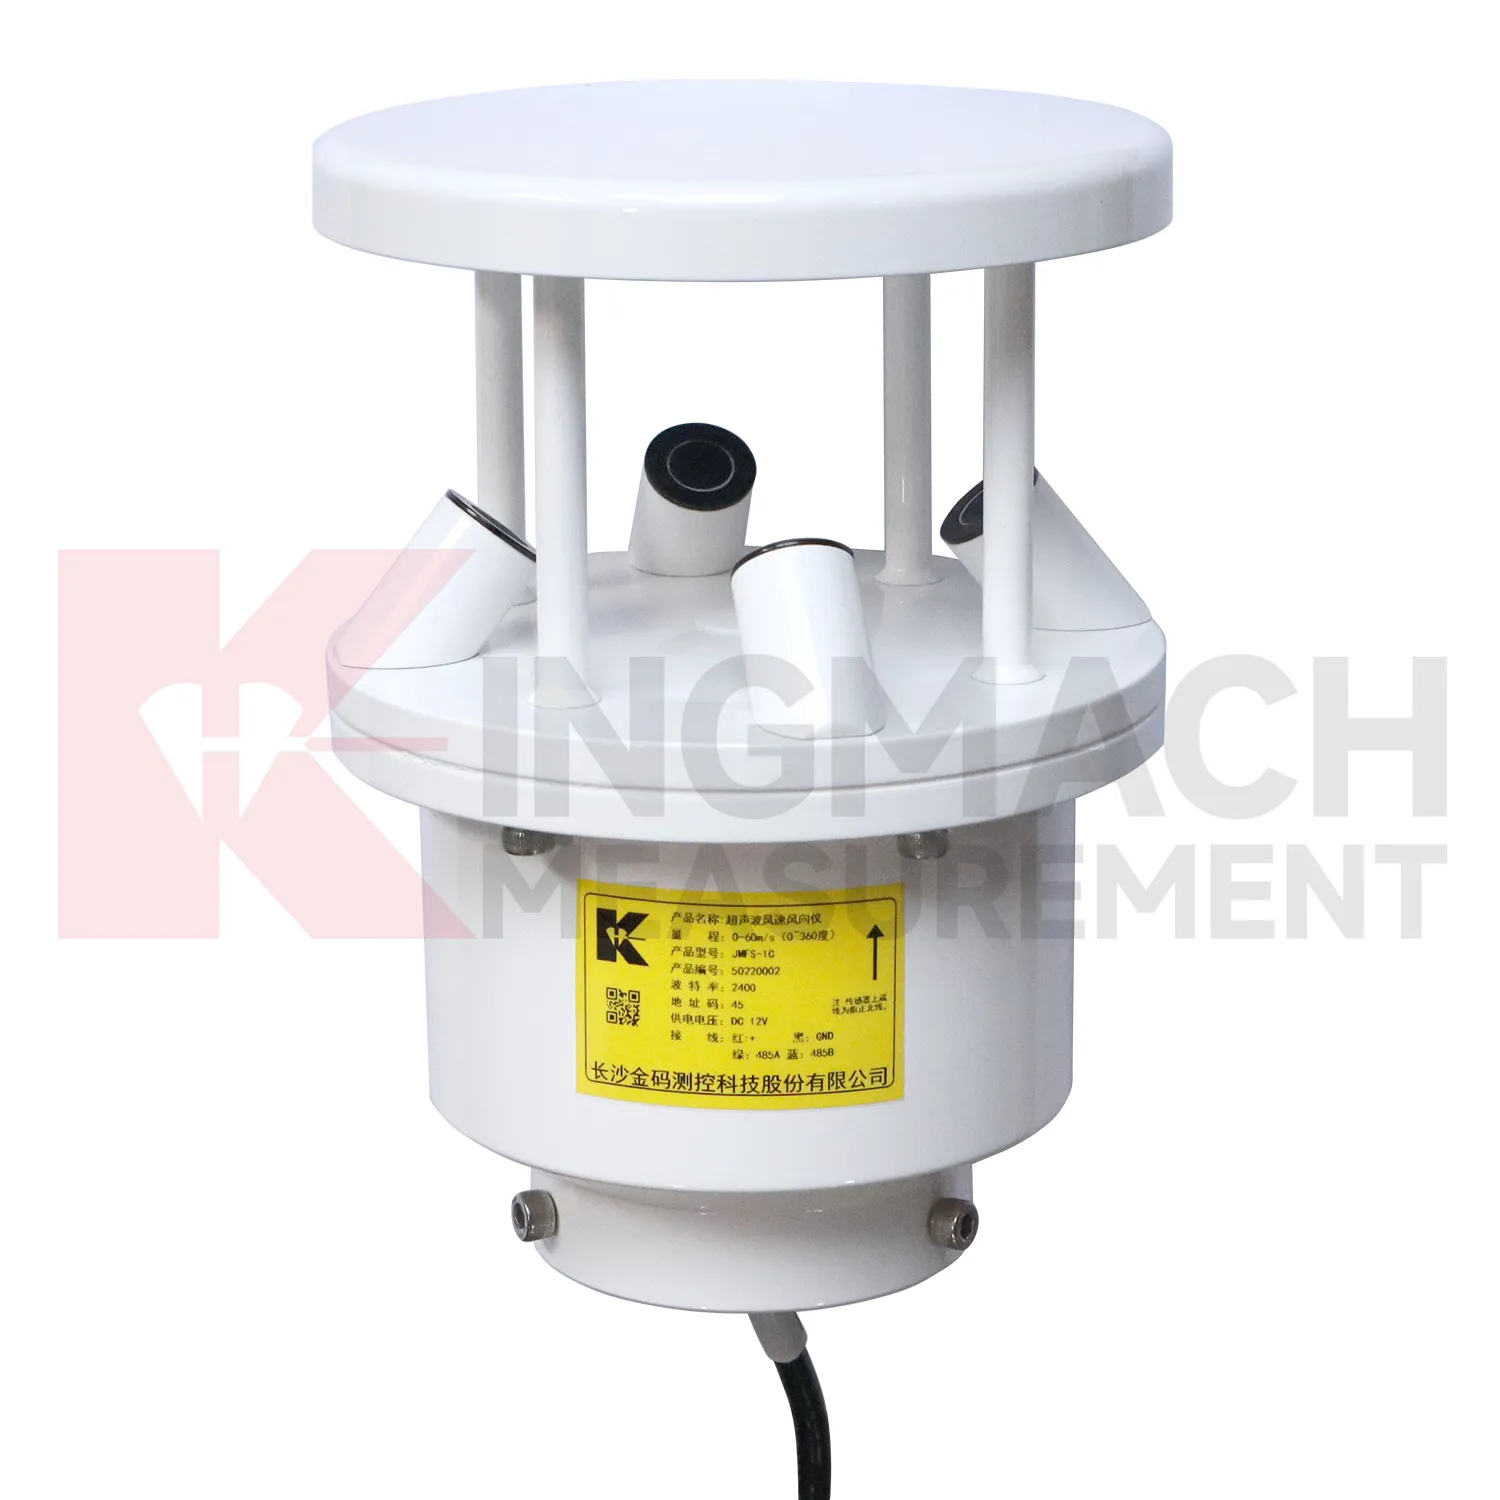
Q: How does wind data support bridge or tower monitoring?
A: Wind direction and exposure can explain vibration, deflection, access difficulty, and weather-driven structural response.
Q: Why monitor humidity underground?
A: Humidity can affect cabinets, connectors, corrosion, sensor stability, and operating conditions in tunnels, subways, mines, and equipment spaces.
Q: How does temperature help interpretation?
A: Temperature helps reviewers separate thermal behavior from structural change in strain, displacement, cabinet condition, or material response.
Long-term value comes from consistency. A channel that keeps the same location, unit, maintenance history, and linked asset record can support seasonal comparison, post-storm review, and handover between construction and operation teams.
Reviews
Andrew Lee
The visualization software is intuitive and powerful. It helps us analyze monitoring data efficiently.
Michael Anderson
The strain gauges and load cells are extremely accurate and stable. They performed very well in our bridge monitoring project. Highly recommended!
Latest Inquiries
To protect the privacy of our buyers, only public service email domains like Gmail, Yahoo, and MSN will be displayed. Additionally, only a limited portion of the inquiry content will be shown.
Amelia***@gmail.comSingapore
Hello, I am looking for visualization software for monitoring system data analysis. Please let me kn...
Mia***@gmail.comNetherlands
Dear team, we are interested in your readouts & data loggers compatible with multiple sensors. Do yo...
Related product categories
- semiconductor based temperature sensor
- semiconductor based ic temperature sensor
- semiconductor-based temperature sensors
- resistance temperature detector sensor
- resistive temperature sensor
- resistance temperature sensor
- platinum resistance temperature sensor
- resistive temperature sensors
- resistance type temperature sensors
- resistance temperature sensors
- temperature sensor resistance
- ambient temperature sensor resistance