
 EN
EN
 ar
ar bg
bg hr
hr cs
cs da
da nl
nl fi
fi fr
fr de
de el
el hi
hi it
it ko
ko no
no pl
pl pt
pt ro
ro ru
ru es
es sv
sv tl
tl iw
iw id
id lv
lv lt
lt sr
sr sk
sk sl
sl uk
uk vi
vi et
et hu
hu th
th tr
tr fa
fa ms
ms hy
hy ka
ka ur
ur bn
bn mn
mn ta
ta kk
kk uz
uz ku
ku
sensor soil moisture
Air temperature and humidity monitoring in Kingmach sensor soil moisture is useful wherever the environment affects people, equipment, cabinets, sensors, or structural interpretation. Underground stations, tunnels, shopping areas, factories, mines, construction zones, and equipment rooms can change quickly after ventilation adjustments, water entry, heating, cooling, or heavy site activity. A temperature and humidity point should be placed where it represents the condition being reviewed, not simply where installation is easy. If the target is a cabinet, the point belongs near the cabinet environment. If the target is an occupied or underground space, the placement should reflect airflow and working conditions. These records help explain condensation, corrosion, electrical faults, concrete curing context, and changes in other sensor readings. They are also useful for maintenance scheduling because repeated high humidity or heat exposure can shorten the life of connectors, enclosures, and acquisition equipment.
For owners, the strongest record is the one that remains understandable after staff changes. Clear units, plain point names, installation photos, maintenance notes, and linked structural channels make the data usable beyond the original project team.
For field teams, this point is most useful when the record shows the condition before the structural response, during the response, and after the site returns to routine operation. The note should include weather timing, inspection access, nearby construction, and whether the linked structural points changed in the same period.
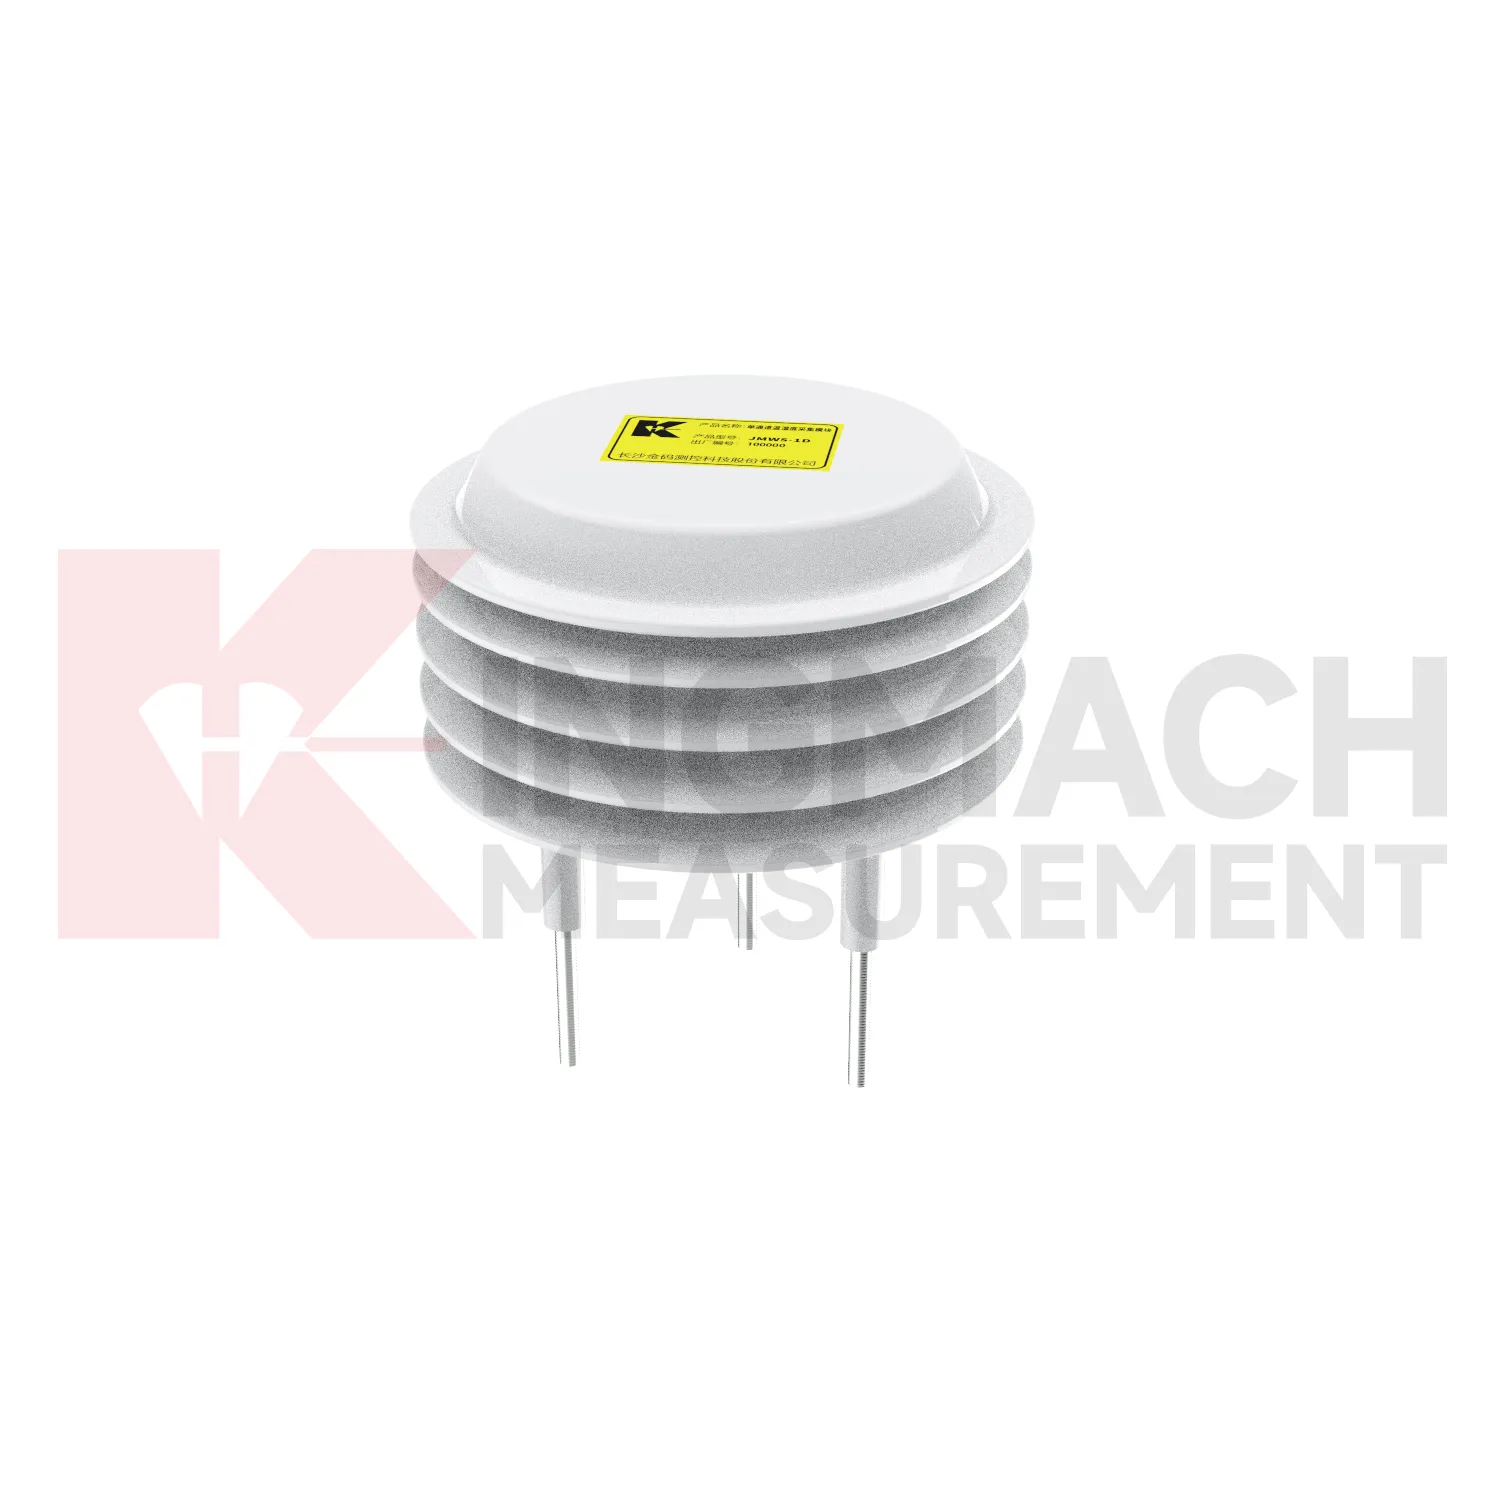
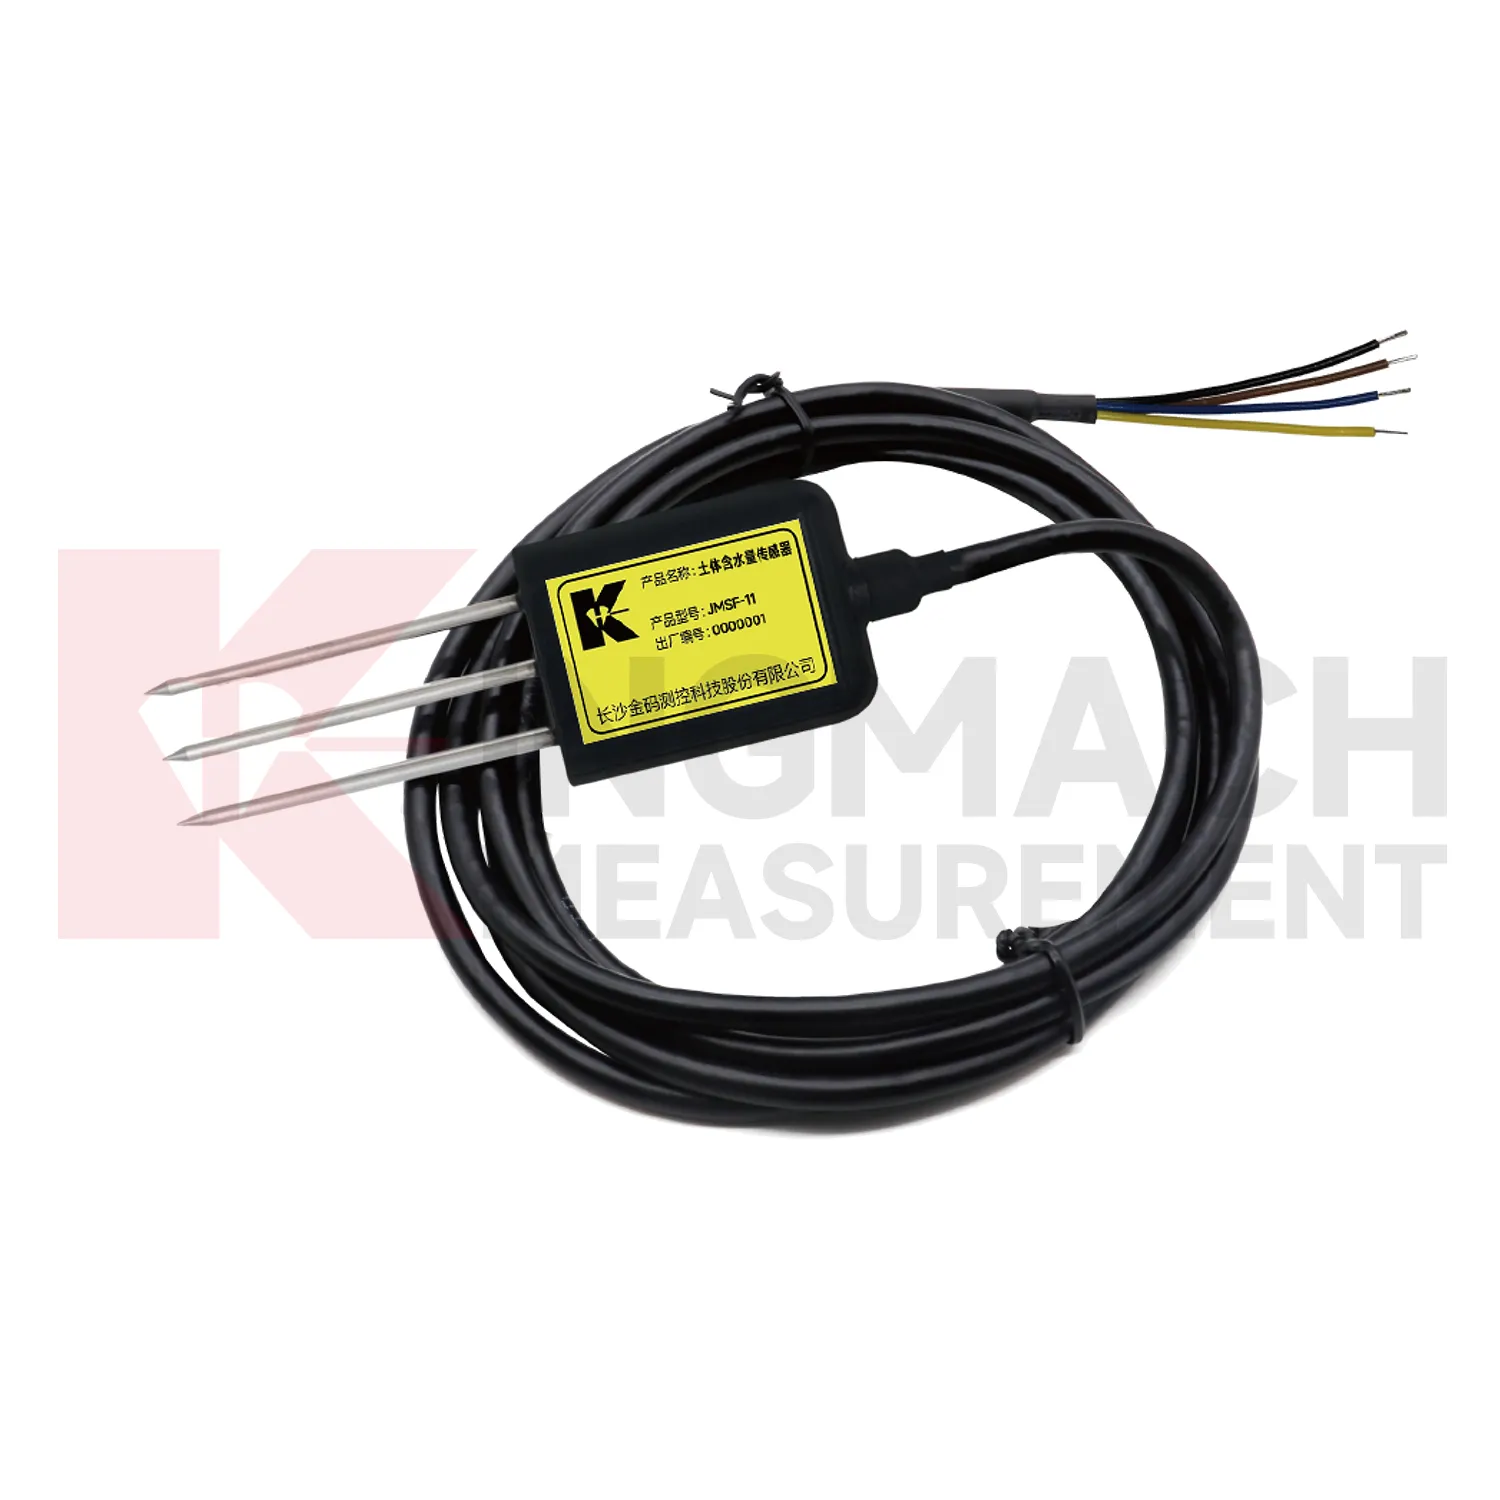
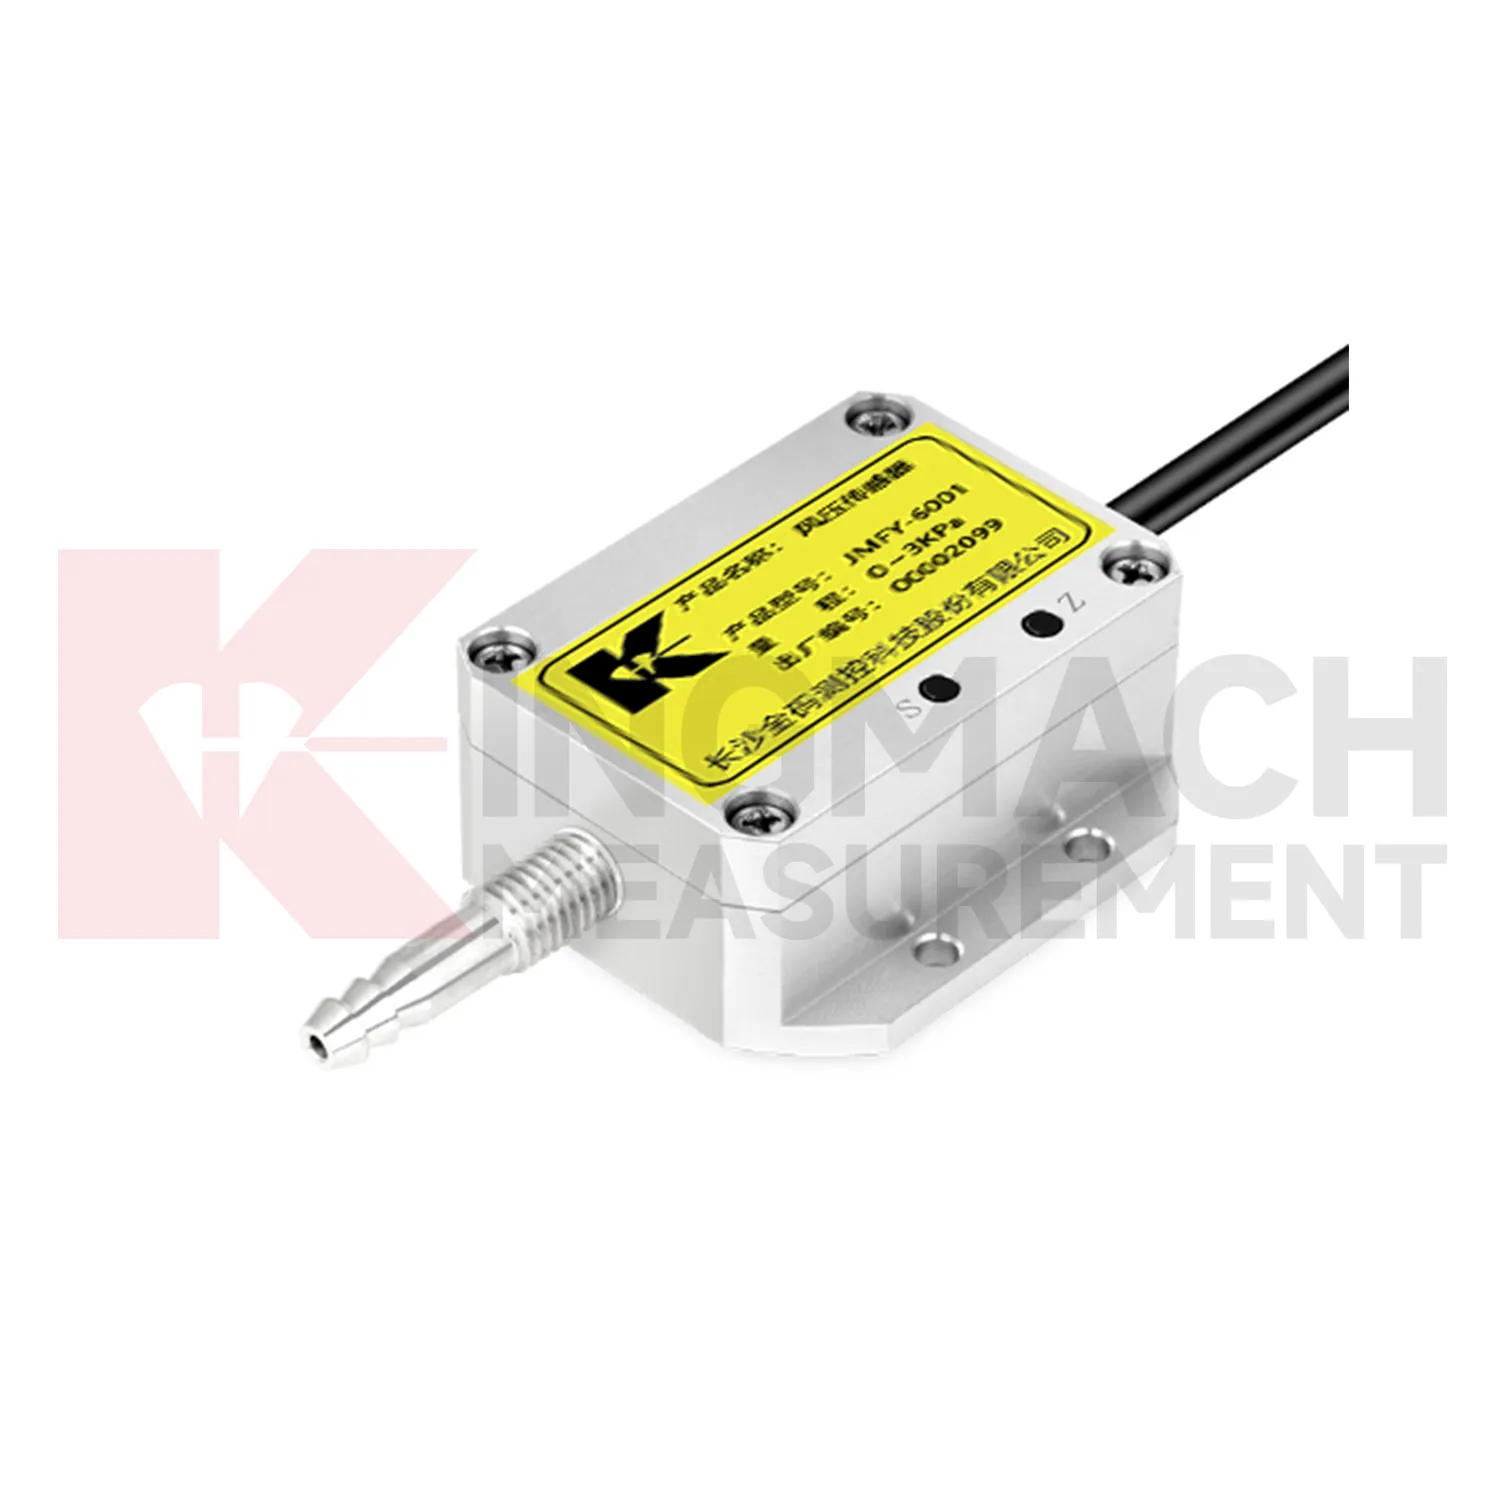
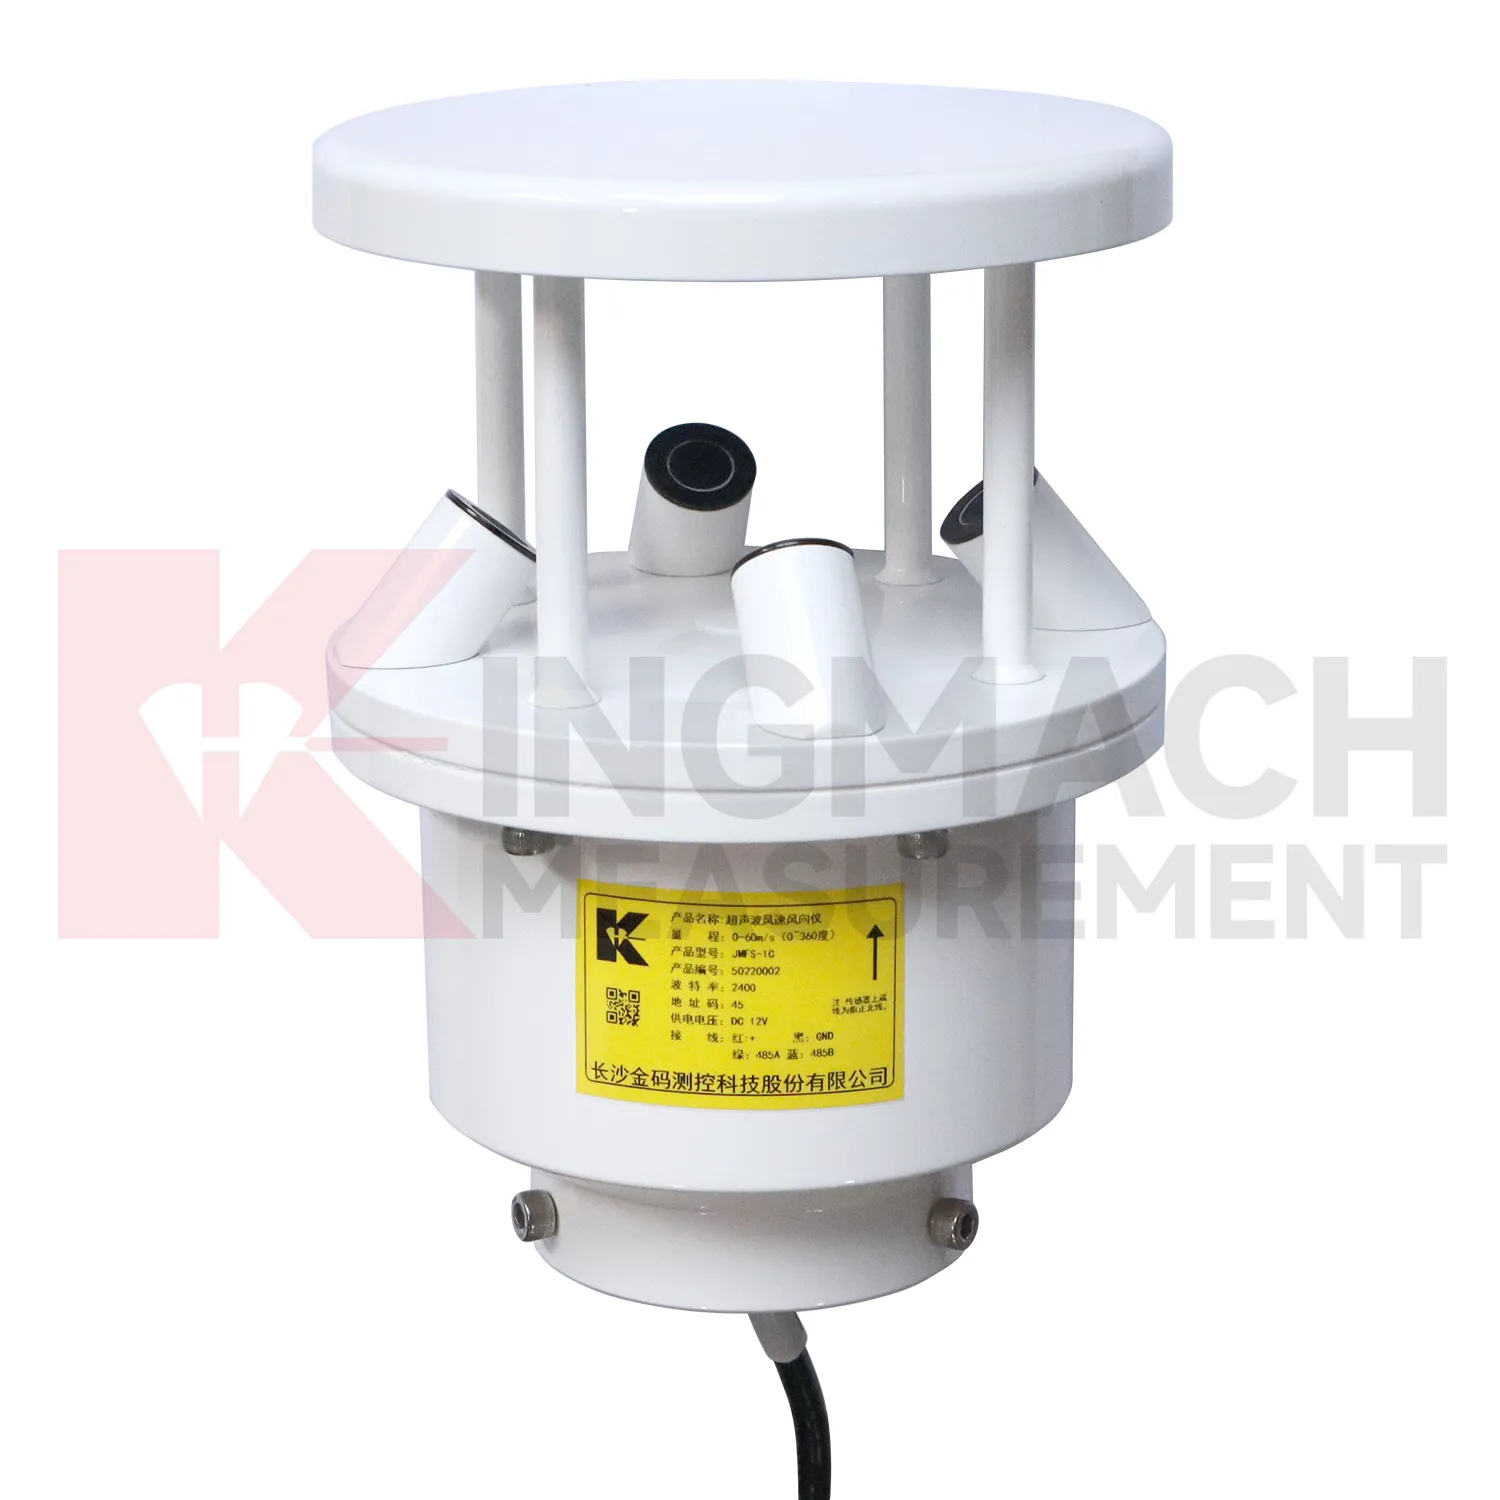
Application of sensor soil moisture
Dam and hydraulic projects use Kingmach sensor soil moisture to understand the environmental background behind seepage, slope movement, settlement, and inspection planning. Rainfall, soil wetness, temperature, and wind exposure can all influence how a dam site behaves. Environmental records should be reviewed with reservoir level, seepage flow, pore pressure, settlement, displacement, and inspection notes. A single storm may not create immediate movement, but repeated wetting may change the ground condition. Temperature cycles may also affect surface readings, equipment cabinets, and concrete behavior. Monitoring points should be placed where they support the dam-safety question, not merely where installation is easy. Over years, these records help teams distinguish seasonal patterns from new or localized changes that require closer review.
The installation file should explain why the location represents the monitored area. If the point is sheltered, shaded, exposed, buried, elevated, or placed inside an enclosure, that fact changes how later readings should be understood by maintenance staff.
During abnormal events, the first question is not only whether the value crossed a limit. The reviewer should ask what changed around the site, whether the related structure reacted, and whether a field inspection confirmed the same pattern.
Long-term value comes from consistency. A channel that keeps the same location, unit, maintenance history, and linked asset record can support seasonal comparison, post-storm review, and handover between construction and operation teams.
The future of sensor soil moisture
Climate exposure will influence future Kingmach sensor soil moisture requirements. Infrastructure owners increasingly face heat, heavy rain, high humidity, strong wind, ice, corrosion, and rapid weather changes. Monitoring stations must remain useful through those conditions, not only measure them. Future specifications should pay attention to enclosure access, cleaning needs, cable aging, connector protection, mounting stability, and weather-event history. Long-term records can help owners see whether repeated exposure affects an asset or the monitoring station itself. The future of environmental measurement is therefore both about recording the environment and keeping the record reliable while the environment is harsh.
If the reading seems unusual, the team should check the physical condition of the station before drawing conclusions about the asset. Blockage, poor exposure, loose wiring, water entry, and changed surroundings can all create misleading patterns.
A practical report links the condition value with time, place, and action. It should help a reviewer decide whether to keep observing, inspect the field point, compare nearby instruments, or record the event as normal site behavior.
Care & Maintenance of sensor soil moisture
Data review is part of maintaining Kingmach sensor soil moisture. Look for impossible values, flatlines, repeated spikes, missing intervals, unit mistakes, and disagreement between related channels. Rainfall should have a plausible relation to wetting; wind pressure should be reviewed with wind exposure; humidity changes should match room or cabinet conditions. If a structural alarm occurs, environmental records should be checked before the team concludes that the structure changed. A good review compares time stamps, site events, maintenance logs, and nearby instruments. This habit keeps environmental records believable and turns them into a reliable part of engineering review.
Review work should also separate data-quality questions from engineering questions. A strange value may come from a blocked rain point, sheltered wind path, wet connector, moved cabinet, or changed unit setting. The reviewer should clear those possibilities before treating the record as a site condition.
Monthly checks can include a short data-quality note that lists missing intervals, unusual values, repaired points, and channels needing field inspection. This makes the environmental network easier to manage and keeps abnormal-event reports from being built on weak records.
Kingmach sensor soil moisture
The data chain behind Kingmach sensor soil moisture should be as clear as the sensors themselves. Environmental channels may use different signal types, units, update intervals, and power needs. If the channel names are weak, a report may confuse rainfall with another station, wind direction with wind speed, or room humidity with cabinet humidity. Each point should have a unit, location, data path, inspection interval, and linked structural record. This prevents environmental data from being collected but ignored. During an alarm, the team should be able to open one timeline and see the condition change, the structural response, and the maintenance note. That is where environmental monitoring becomes practical.
During abnormal events, the first question is not only whether the value crossed a limit. The reviewer should ask what changed around the site, whether the related structure reacted, and whether a field inspection confirmed the same pattern.
Long-term value comes from consistency. A channel that keeps the same location, unit, maintenance history, and linked asset record can support seasonal comparison, post-storm review, and handover between construction and operation teams.
FAQ
Q: Can environmental data support asset management?
A: Yes. Long-term records help owners compare weather, exposure, maintenance events, and structural response across seasons and assets.
Q: How does it help during alarms?
A: It lets reviewers check whether a structural alarm followed rain, wind, temperature change, humidity rise, or another site condition.
Q: What should dashboards show?
A: Dashboards should link environmental channels to the structural risks they explain, rather than displaying unrelated values together.
Q: Why avoid product-list writing?
A: Readers need to understand monitoring purpose and field value; long product lists make the page harder to use and less natural.
Q: What is the best review habit?
A: Review environmental data with time-aligned structural readings, inspection notes, maintenance records, and the site event that triggered concern.
If the reading seems unusual, the team should check the physical condition of the station before drawing conclusions about the asset. Blockage, poor exposure, loose wiring, water entry, and changed surroundings can all create misleading patterns.
Reviews
Ryan Lewis
Fast delivery and excellent product quality. The accelerometers and tiltmeters are highly reliable. Strongly recommend this company.
James Thompson
The tiltmeters and accelerometers are very sensitive and provide precise data. Perfect for our structural health monitoring system.
Latest Inquiries
To protect the privacy of our buyers, only public service email domains like Gmail, Yahoo, and MSN will be displayed. Additionally, only a limited portion of the inquiry content will be shown.
Mia***@gmail.comNetherlands
Dear team, we are interested in your readouts & data loggers compatible with multiple sensors. Do yo...
Charlotte***@gmail.comUnited Arab Emirates
Hi, we require instrumentation cables suitable for harsh environments. Could you advise on specifica...
Related product categories
- resistance of temperature sensor
- Temperature and Humidity Acquisition Module
- water temperature sensor resistance
- soil moisture sensor
- soil moisture sensors
- capacitive soil moisture sensor
- best soil moisture sensor
- capacitive soil moisture sensors
- sensor soil moisture
- soil moisture sensor reviews
- capacitive soil moisture sensor v1 2
- resistive soil moisture sensor